MATLAB(四)初阶绘图
文章目录
前言
此篇文章是我在B站学习时所做的笔记,主要讲基本绘图和图形对象属性语句,部分为亲自动手演示过的,方便复习用。此篇文章仅供学习参考。
提示:以下是本篇文章正文内容,下面案例可供参考
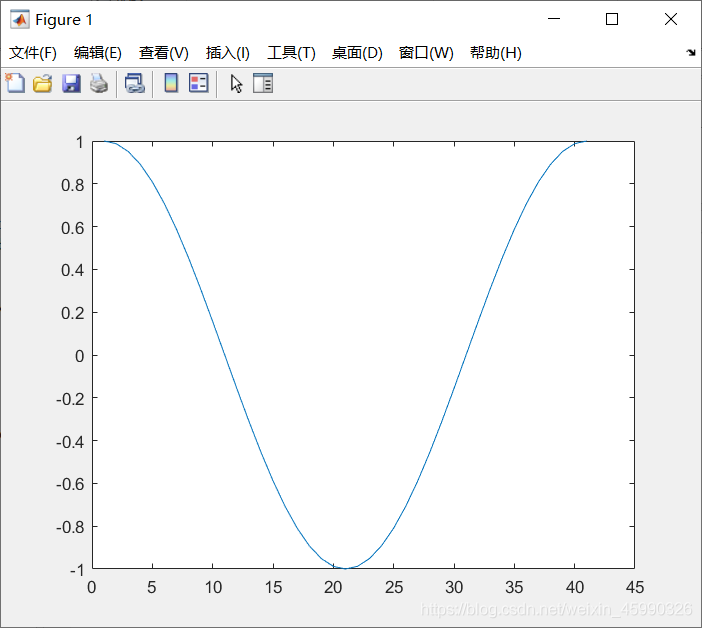
plot()
- plot (x,y)绘制每个向量对(x,y)
- plot (y)绘制每个向量对(x, y),其中x=[1… .n], n =length(y)
>> plot(cos(0:pi/20:2*pi));
hold on/off
如果这样输入,它会把旧的图形清掉,再画图。
>> plot(cos(0:pi/20:2*pi));
plot(sin(0:pi/20:2*pi));

- 使用hold on可以在一个图形中有两个图像
>> hold on
plot(cos(0:pi/20:2*pi));
plot(sin(0:pi/20:2*pi));
hold off

Plot Style
使用str中定义的格式绘制每个向量对(x,y)
具体知识点可以点击👉linespec线条设定了解
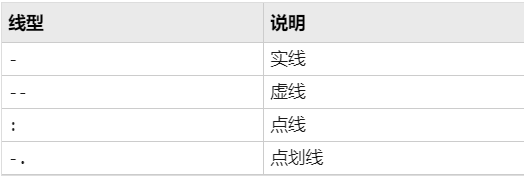
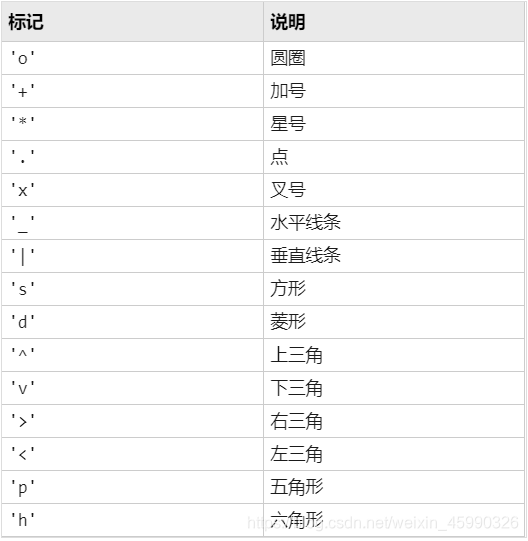
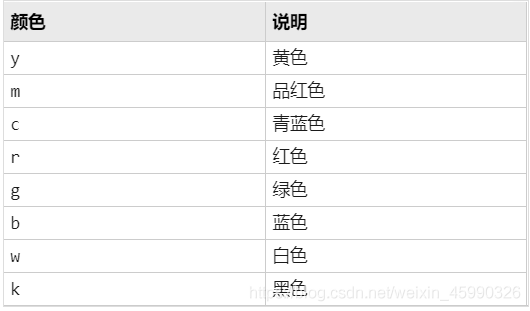
线型、标记符号和颜色
您可以指明要显示的线型、标记和颜色,下表进行了详细介绍:
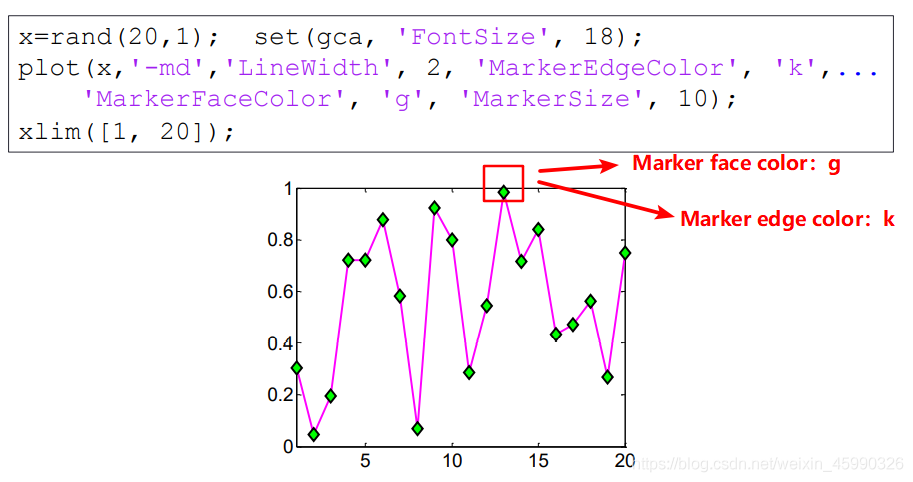
MATLAB® 图形允许您控制下列直观特征:
LineWidth - 指定线条的宽度(以磅为单位)。
MarkerEdgeColor - 指定标记颜色或填充标记(圆形、方形、菱形、五角形、六角形和四个三角形)的边颜色。
MarkerFaceColor - 指定填充标记的面的颜色。
MarkerSize - 指定标记的大小(以磅为单位,必须大于 0)。
此外,还可以指定 LineStyle、Color 和 Marker 属性,而不使用线条设定字符向量。如果要使用 RGB 三元组指定不在列表中的颜色,则该属性非常有用。
修改线条外观
您可以为线条指定以下三个要素:
- 线型
- 标记符号
- 颜色
说明:使用划线 (- -) 绘制 x-y 图,在数据点位置放置圆形标记 (o),并将线条和标记设置为红色 ®。可在数据参数之后,以字符向量形式指定各要素(任意顺序)。请注意,线条设定不是名称-值对组。
>> hold on
plot(cos(0:pi/20:2*pi),'or--');
plot(sin(0:pi/20:2*pi),'xg:');
hold off

legend()
向图中添加图例
举例:
>> x=0:0.5:4*pi;
y=sin(x); h=cos(x); w=1./(1+exp(-x));
g=(1/(2*pi*2)^0.5).*exp((-1.*(x-2*pi).^2)./(2*2^2));
plot(x,y,'bd-',x,h,'gp:',x,w,'ro-',x,g,'c^-');
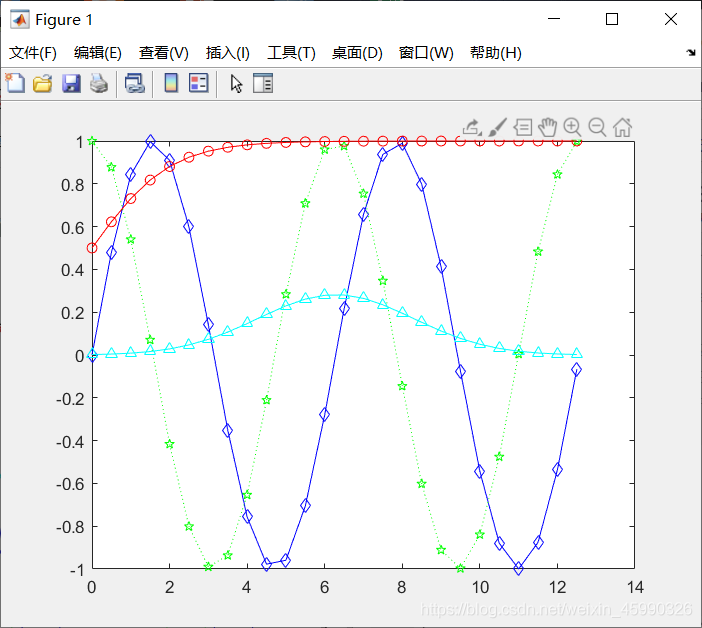
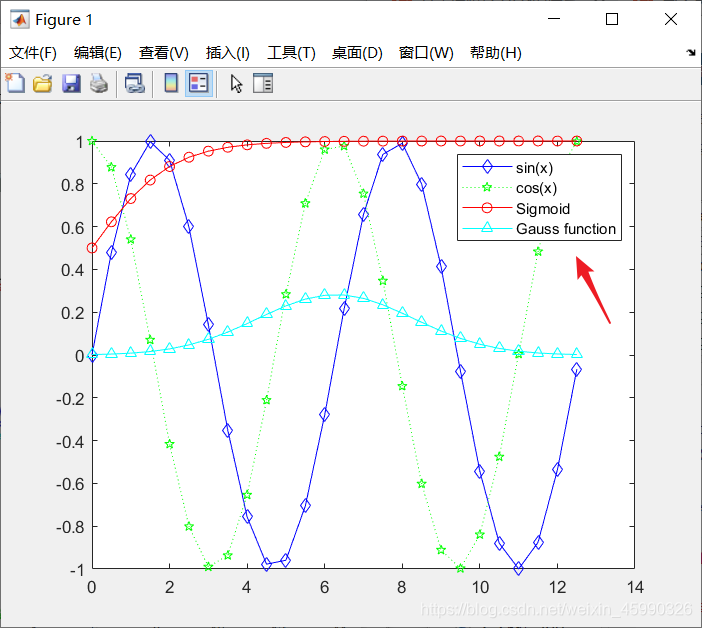
在上面的程式中再添加下面的代码,即可添加图例
>> legend('sin(x)','cos(x)','Sigmoid','Gauss function');
title()和?label()
显示标题、标签、图例

>> x = 0:0.1:2*pi; y1 = sin(x); y2 = exp(-x);
plot(x, y1, '--*', x, y2, ':o');
xlabel('t = 0 to 2\pi');
ylabel('values of sin(t) and e^{-x}')
title('Function Plots of sin(t) and e^{-x}');
legend('sin(t)','e^{-x}');

Text()和annotation()
文本与数学表达式使用LaTex
点击了解👉text 向数据点添加文本说明
点击了解👉Text属性 坐标区文本的外观和行为
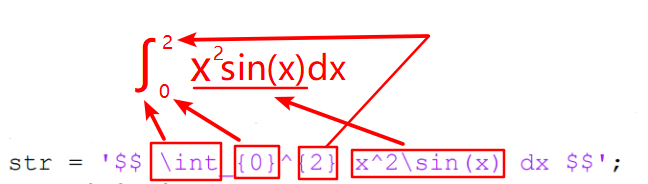
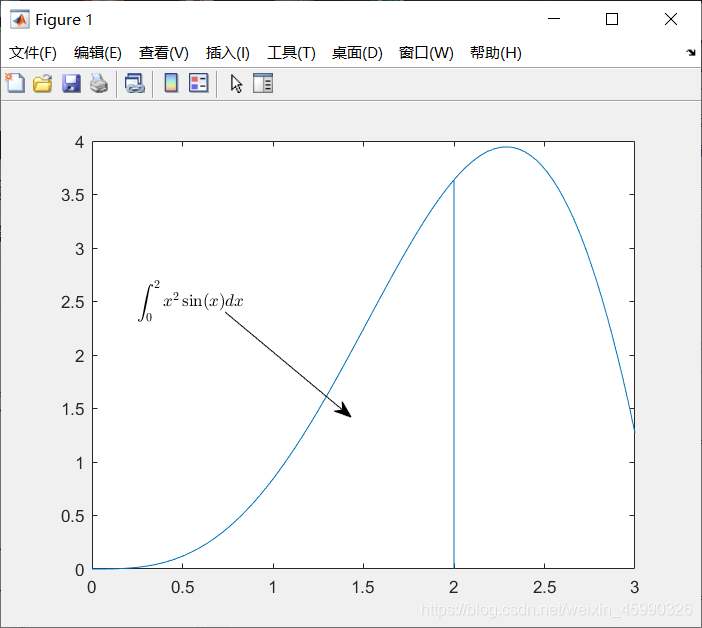
\int=∫ str是积分式子,text中的0.25,2.5是这个积分在坐标中的位置
点击了解👉annotation()创建注释:用于画箭头
X、Y是箭头的位置相对于整个方框的比例,
[0.32,0.5]是指:x坐标从整个图形32%的地方到50%的地方(从左到右)
[0.6,0.4]是指:y坐标从60%的地方到40%的地方(从上到下)
点击了解👉line()创建基本线条
>> x = linspace(0,3); y = x.^2.*sin(x); plot(x,y);
line([2,2],[0,2^2*sin(2)]);
str = '$$ \int_{0}^{2} x^2\sin(x) dx $$';
text(0.25,2.5,str,'Interpreter','latex');
annotation('arrow','X',[0.32,0.5],'Y',[0.6,0.4]);
Exercise练习
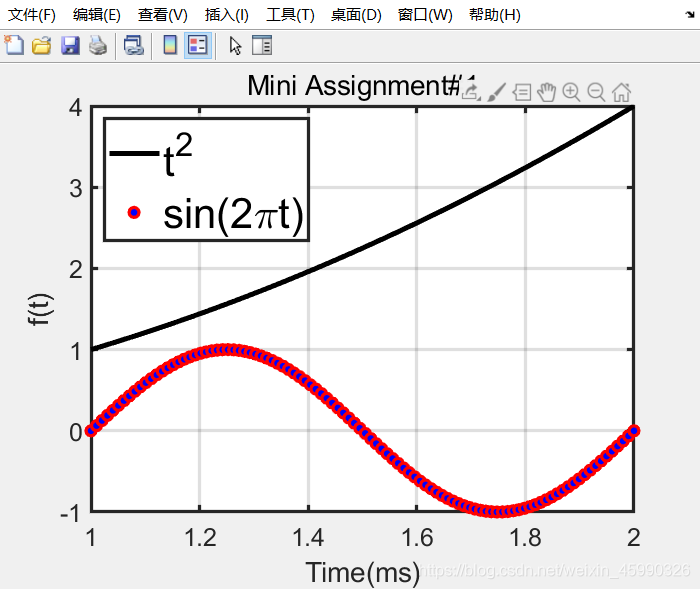
将f画成一条黑线,将g画成一系列红色圆圈,在一个图中表示范围t = 1到2,给每个轴标上标签,并添加标题和图例。
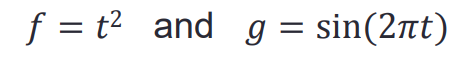
t=linspace(1,2);
f=t.^2;
g=sin(2*pi*t);
plot(t,f,'k-',t,g,'or')
legend('t^2','sin(2\pit)','location','northwest')
%legend('t^{2}','sin(2\pi*{t}','location','northwest')
title('Mini Assignment#1')
xlabel('Time(ms)')
ylabel('f(t)')
xticks(1:0.2:2)
location指将图例放置在什么地方,后接英文的东南西北。
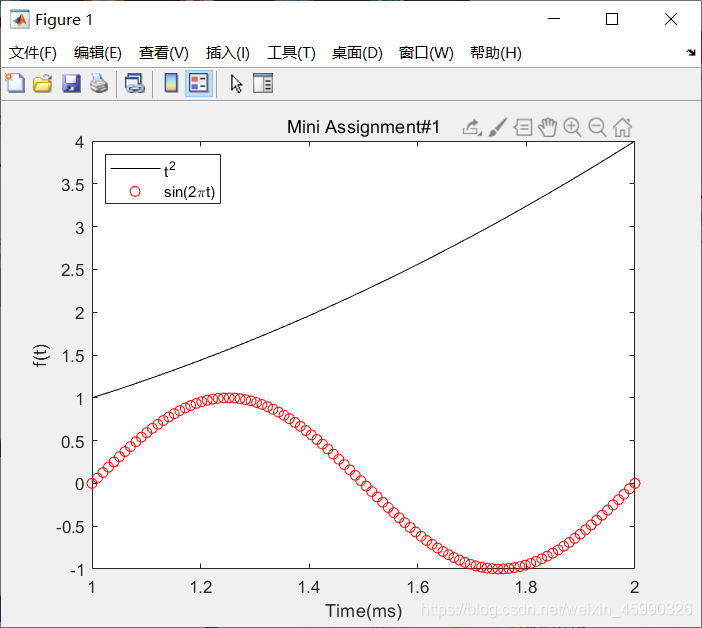
如果设置t=(1:0.2:2);则不会出现连续的圈圈。

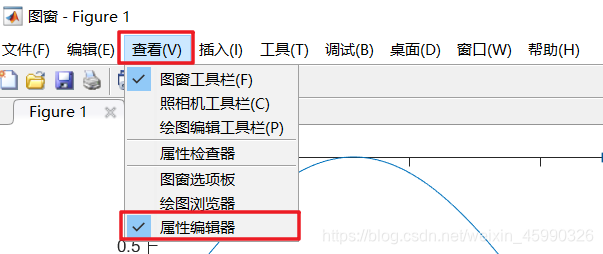
图调整
几个属性:
- Font 字体
- Font size 字体大小
- Line width 线宽
- Axis limit 轴的限制
- Tick position 标记的位置
- Tick label 标记的标签
图形对象
图形是由许多物体组成的

图像的属性


修改对象属性
- 标识一个对象的handle

获取或修改属性
要获取属性,请使用get()
要修改属性,请使用set()
获取对象属性
- 获取图形对象的属性:get ()
>> x = linspace(0, 2*pi, 1000);
y = sin(x); h = plot(x,y);
axes:坐标轴

获取h函数的属性
>> get(h)
    AlignVertexCenters: 'off'
            Annotation: [1×1 matlab.graphics.eventdata.Annotation]
          BeingDeleted: 'off'
            BusyAction: 'queue'
         ButtonDownFcn: ''
              Children: [0×0 GraphicsPlaceholder]
              Clipping: 'on'
                 Color: [0 0.4470 0.7410]
             ColorMode: 'auto'
             CreateFcn: ''
       DataTipTemplate: [1×1 matlab.graphics.datatip.DataTipTemplate]
             DeleteFcn: ''
           DisplayName: ''
      HandleVisibility: 'on'
               HitTest: 'on'
         Interruptible: 'on'
              LineJoin: 'round'
             LineStyle: '-'
         LineStyleMode: 'auto'
             LineWidth: 0.5000
                Marker: 'none'
       MarkerEdgeColor: 'auto'
       MarkerFaceColor: 'none'
         MarkerIndices: [1×1000 uint64]
            MarkerMode: 'auto'
            MarkerSize: 6
                Parent: [1×1 Axes]
         PickableParts: 'visible'
              Selected: 'off'
    SelectionHighlight: 'on'
                   Tag: ''
                  Type: 'line'
         UIContextMenu: [0×0 GraphicsPlaceholder]
              UserData: []
               Visible: 'on'
                 XData: [1×1000 double]
             XDataMode: 'manual'
           XDataSource: ''
                 YData: [1×1000 double]
           YDataSource: ''
                 ZData: [1×0 double]
           ZDataSource: ''
获取坐标轴属性
>> get(gca)
                       ALim: [0 1]
                   ALimMode: 'auto'
     ActivePositionProperty: 'outerposition'
                 AlphaScale: 'linear'
                   Alphamap: [1×64 double]
          AmbientLightColor: [1 1 1]
               BeingDeleted: 'off'
                        Box: 'on'
                   BoxStyle: 'back'
                 BusyAction: 'queue'
              ButtonDownFcn: ''
                       CLim: [0 1]
                   CLimMode: 'auto'
             CameraPosition: [3.5000 0 17.3205]
         CameraPositionMode: 'auto'
               CameraTarget: [3.5000 0 0]
           CameraTargetMode: 'auto'
             CameraUpVector: [0 1 0]
         CameraUpVectorMode: 'auto'
            CameraViewAngle: 6.6086
        CameraViewAngleMode: 'auto'
                   Children: [1×1 Line]
                   Clipping: 'on'
              ClippingStyle: '3dbox'
                      Color: [1 1 1]
                 ColorOrder: [7×3 double]
            ColorOrderIndex: 2
                 ColorScale: 'linear'
                   Colormap: [256×3 double]
                  CreateFcn: ''
               CurrentPoint: [2×3 double]
            DataAspectRatio: [3.5000 1 1]
        DataAspectRatioMode: 'auto'
                  DeleteFcn: ''
                  FontAngle: 'normal'
                   FontName: 'Helvetica'
                   FontSize: 10
               FontSizeMode: 'auto'
              FontSmoothing: 'on'
                  FontUnits: 'points'
                 FontWeight: 'normal'
                  GridAlpha: 0.1500
              GridAlphaMode: 'auto'
                  GridColor: [0.1500 0.1500 0.1500]
              GridColorMode: 'auto'
              GridLineStyle: '-'
           HandleVisibility: 'on'
                    HitTest: 'on'
               Interactions: [1×1 matlab.graphics.interaction.interface.DefaultAxesInteractionSet]
              Interruptible: 'on'
    LabelFontSizeMultiplier: 1.1000
                      Layer: 'bottom'
                     Layout: [0×0 matlab.ui.layout.LayoutOptions]
                     Legend: [0×0 GraphicsPlaceholder]
             LineStyleOrder: '-'
        LineStyleOrderIndex: 1
                  LineWidth: 0.5000
             MinorGridAlpha: 0.2500
         MinorGridAlphaMode: 'auto'
             MinorGridColor: [0.1000 0.1000 0.1000]
         MinorGridColorMode: 'auto'
         MinorGridLineStyle: ':'
                   NextPlot: 'replace'
              OuterPosition: [0 0 1 1]
                     Parent: [1×1 Figure]
              PickableParts: 'visible'
         PlotBoxAspectRatio: [1 0.7882 0.7882]
     PlotBoxAspectRatioMode: 'auto'
                   Position: [0.1300 0.1100 0.7750 0.8150]
                 Projection: 'orthographic'
                   Selected: 'off'
         SelectionHighlight: 'on'
                 SortMethod: 'childorder'
                        Tag: ''
                    TickDir: 'in'
                TickDirMode: 'auto'
       TickLabelInterpreter: 'tex'
                 TickLength: [0.0100 0.0250]
                 TightInset: [0.0510 0.0527 0.0071 0.0200]
                      Title: [1×1 Text]
    TitleFontSizeMultiplier: 1.1000
            TitleFontWeight: 'normal'
                    Toolbar: [1×1 AxesToolbar]
                       Type: 'axes'
              UIContextMenu: [0×0 GraphicsPlaceholder]
                      Units: 'normalized'
                   UserData: []
                       View: [0 90]
                    Visible: 'on'
                      XAxis: [1×1 NumericRuler]
              XAxisLocation: 'bottom'
                     XColor: [0.1500 0.1500 0.1500]
                 XColorMode: 'auto'
                       XDir: 'normal'
                      XGrid: 'off'
                     XLabel: [1×1 Text]
                       XLim: [0 7]
                   XLimMode: 'auto'
                 XMinorGrid: 'off'
                 XMinorTick: 'off'
                     XScale: 'linear'
                      XTick: [0 1 2 3 4 5 6 7]
                 XTickLabel: {8×1 cell}
             XTickLabelMode: 'auto'
         XTickLabelRotation: 0
                  XTickMode: 'auto'
                      YAxis: [1×1 NumericRuler]
              YAxisLocation: 'left'
                     YColor: [0.1500 0.1500 0.1500]
                 YColorMode: 'auto'
                       YDir: 'normal'
                      YGrid: 'off'
                     YLabel: [1×1 Text]
                       YLim: [-1 1]
                   YLimMode: 'auto'
                 YMinorGrid: 'off'
                 YMinorTick: 'off'
                     YScale: 'linear'
                      YTick: [1×11 double]
                 YTickLabel: {11×1 cell}
             YTickLabelMode: 'auto'
         YTickLabelRotation: 0
                  YTickMode: 'auto'
                      ZAxis: [1×1 NumericRuler]
                     ZColor: [0.1500 0.1500 0.1500]
                 ZColorMode: 'auto'
                       ZDir: 'normal'
                      ZGrid: 'off'
                     ZLabel: [1×1 Text]
                       ZLim: [-1 1]
                   ZLimMode: 'auto'
                 ZMinorGrid: 'off'
                 ZMinorTick: 'off'
                     ZScale: 'linear'
                      ZTick: [-1 0 1]
                 ZTickLabel: ''
             ZTickLabelMode: 'auto'
         ZTickLabelRotation: 0
                  ZTickMode: 'auto'
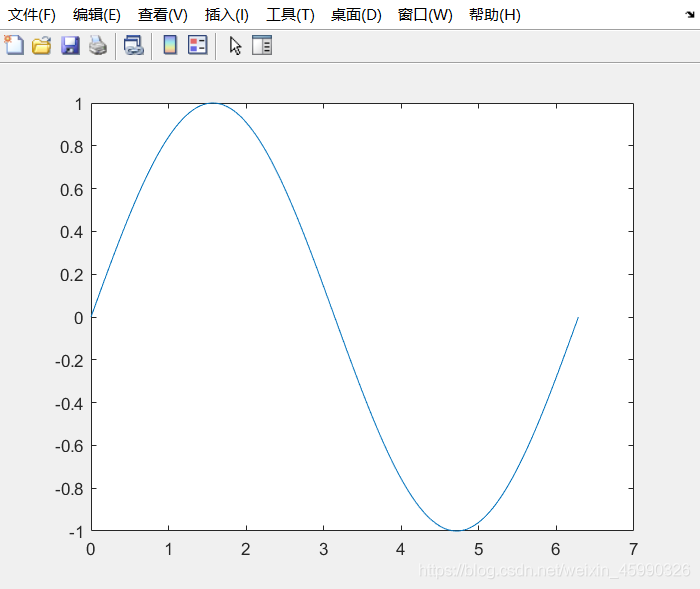
设置轴的限制
>> x = linspace(0, 2*pi, 1000);
y = sin(x); h = plot(x,y);
生成图像后,不要关闭窗口,下面才能设置属性

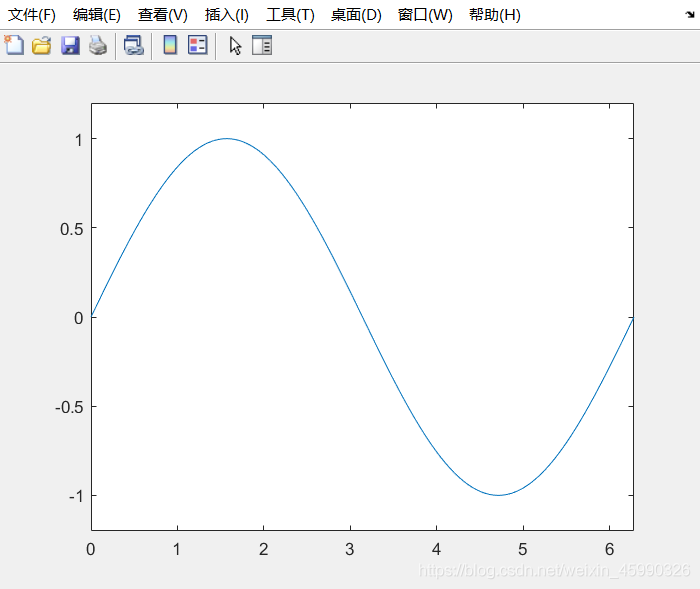
接着上面的代码设置轴的限制
>> set(gca, 'XLim', [0, 2*pi]);
set(gca, 'YLim', [-1.2, 1.2]);
可以看到坐标轴的刻度已经发生变化
设置轴的字体和刻度
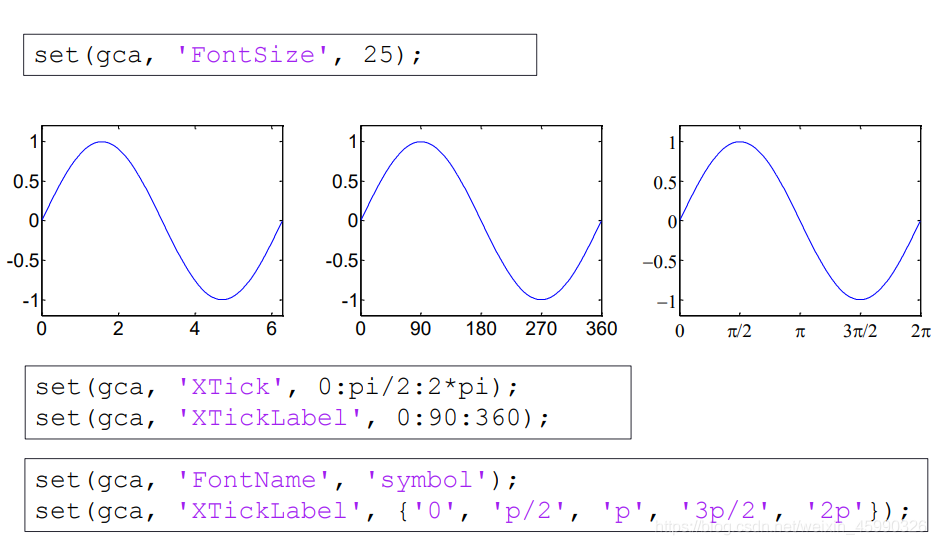
线规范
点击了解👉text 向数据点添加文本说明
点击了解👉Text属性 坐标区文本的外观和行为
点击了解👉Line 图形线条的外观和行为
转载于漓艾初 matlab 关于interpreter的使用
https://blog.csdn.net/aron_conli/article/details/104815829

标记规范
标记器的面和边缘颜色
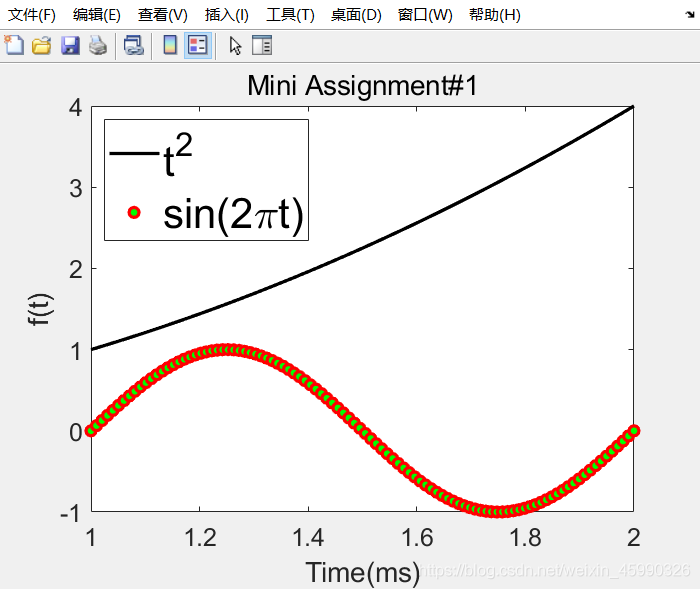
Exercise 练习
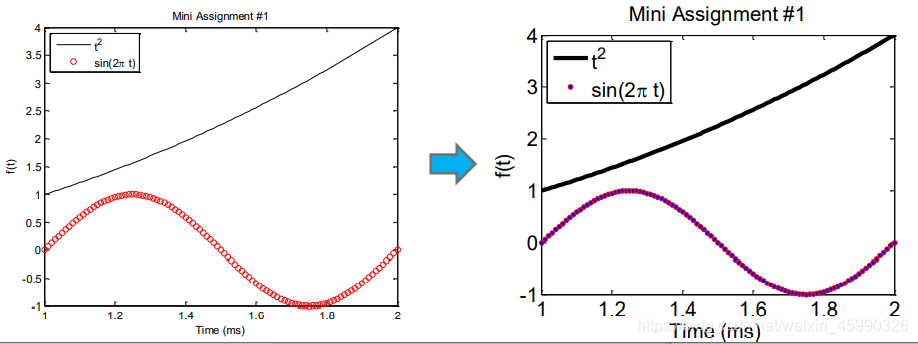
t=linspace(1,2);
f=t.^2;
g=sin(2*pi*t);
plot(t,f,'k-',t,g,'or');
h=plot(t,f,'k-',t,g,'or')
legend('t^2','sin(2\pit)','location','northwest','FontSize',25);
title('Mini Assignment#1')
xlabel('Time(ms)')
ylabel('f(t)')
xticks(1:0.2:2)
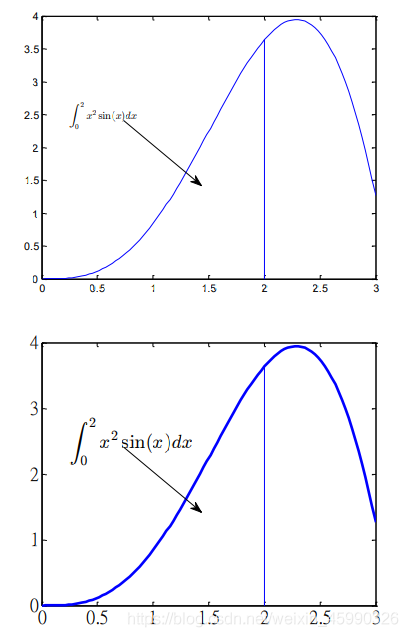
set(h,'LineWidth',2);
set(gca,'FontSize',15);
set(h,'MarkerFaceColor','g');
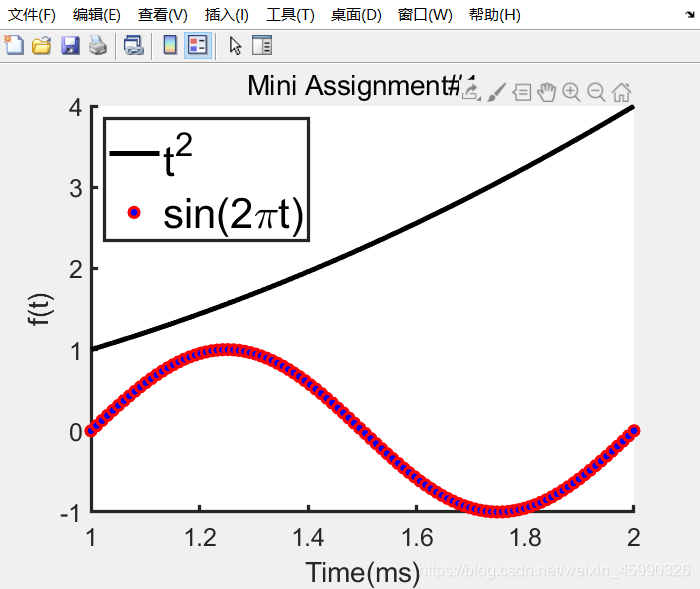
t=linspace(1,2);
f=t.^2;
g=sin(2*pi*t);
hold on
a=plot(t,f,'k-','LineWidth',3);
h=plot(t,g,'or');
hold off
legend('t^2','sin(2\pit)','location','northwest','FontSize',25);
title('Mini Assignment#1')
xlabel('Time(ms)')
ylabel('f(t)')
xticks(1:0.2:2)
set(h,'LineWidth',2);
set(gca,'FontSize',15);
set(gca,'LineWidth',2);
set(h,'MarkerFaceColor','#0000ff');
多个图像

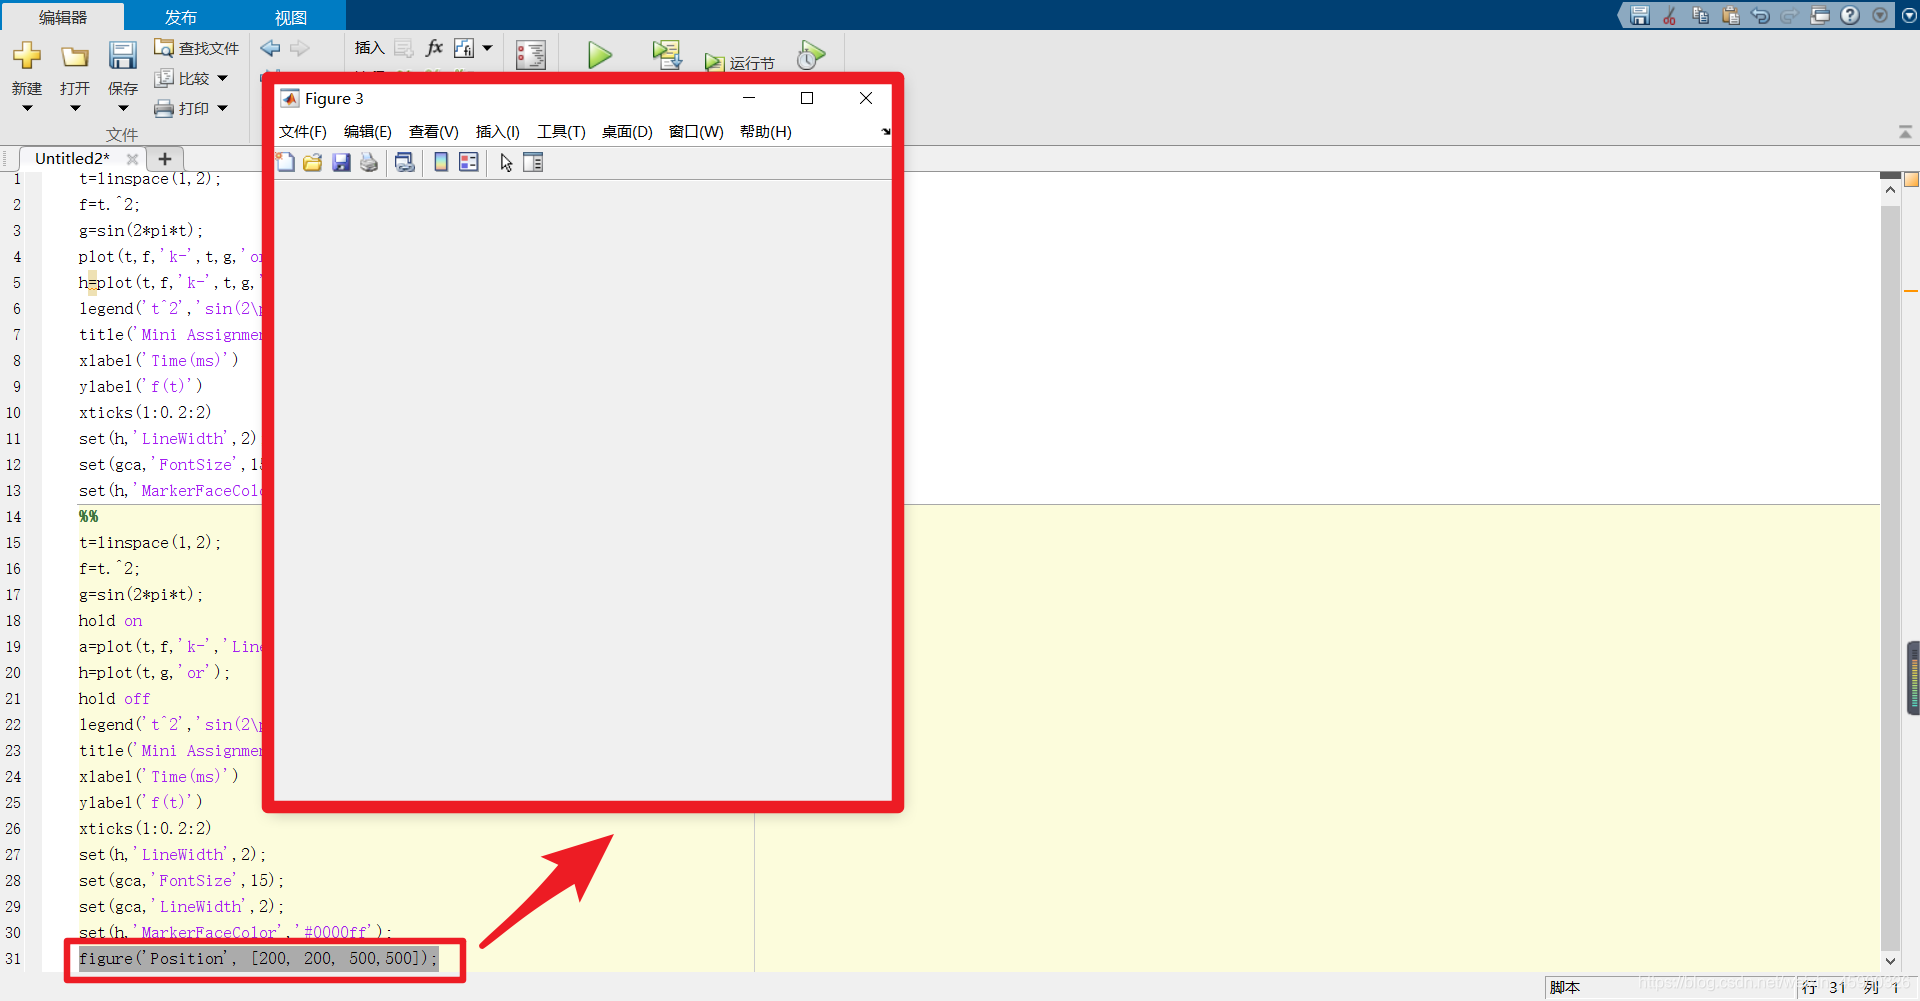
图像的位置和尺寸
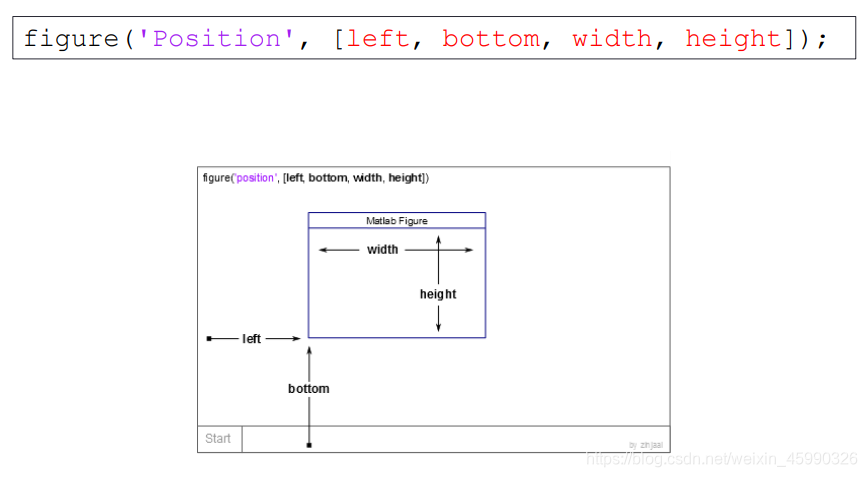
例如:
figure('Position', [200, 200, 500,500]);
一个图像里边的多个图表
“一个图像”中的几个小图表
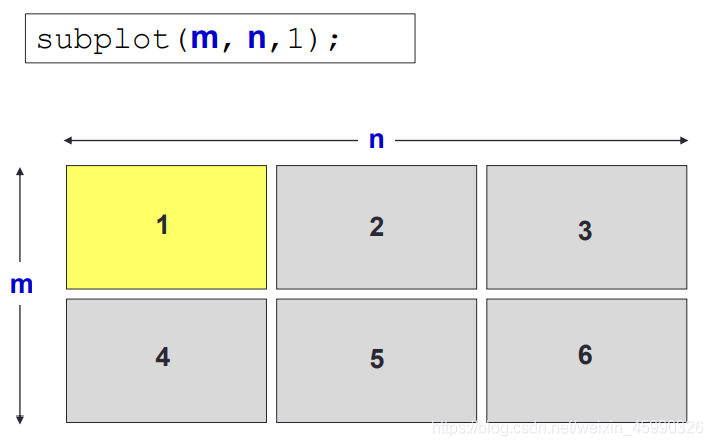
subplot()
控制网格、框和轴
| grid on/off | 使网格可见或不可见 |
|---|---|
| box on/off | 使盒子可见或不可见 |
| axis on/off | 使坐标轴可见或不可见 |
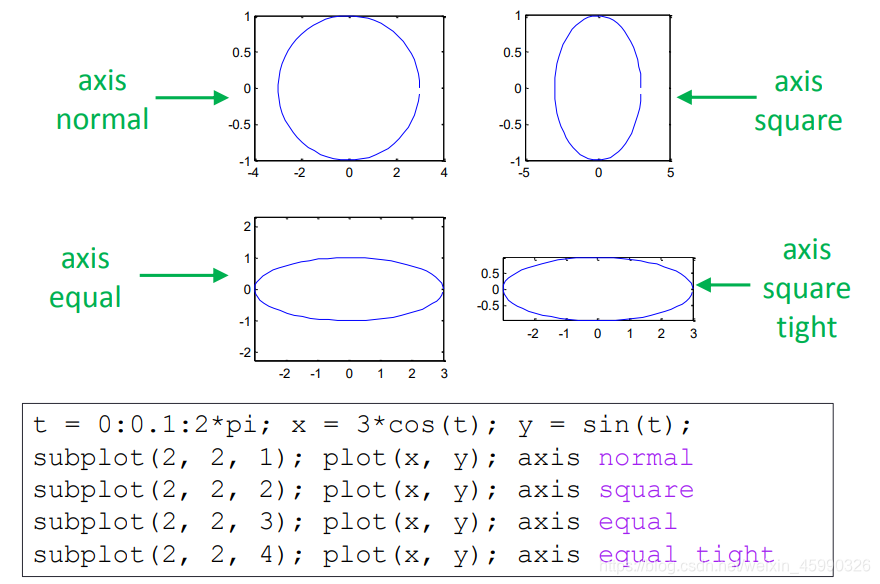
| axis normal | 自动调整轴的长宽比和数据单位的相对缩放 |
| axis square | 使当前坐标轴区域为正方形 |
| axis equal | 设置高宽比,使数据单元在每个方向上都是相同的 |
| axis equal tight | 将轴限制设置为数据的范围 |
| axis image | 图框紧紧地围绕着数据 |
| axis ij | 将坐标系统的原点放在左上角 |
| axis xy | 把原点放在左下角 |
如:在图像上加网格和盒子,坐标轴是默认为axis on,加不加都会显示。
axis on
t=linspace(1,2);
f=t.^2;
g=sin(2*pi*t);
hold on
a=plot(t,f,'k-','LineWidth',3);
h=plot(t,g,'or');
hold off
legend('t^2','sin(2\pit)','location','northwest','FontSize',25);
title('Mini Assignment#1')
xlabel('Time(ms)')
ylabel('f(t)')
xticks(1:0.2:2)
set(h,'LineWidth',2);
set(gca,'FontSize',15);
set(gca,'LineWidth',2);
set(h,'MarkerFaceColor','#0000ff');
%figure('f', [200, 200, 500,500]);
grid on
box on
axis on
将数据保存到文件中

点击了解👉print 打印图窗或保存为特定文件格式
如若侵权,请及时与我联系。
此篇文章仅供学习参考,禁止转载!