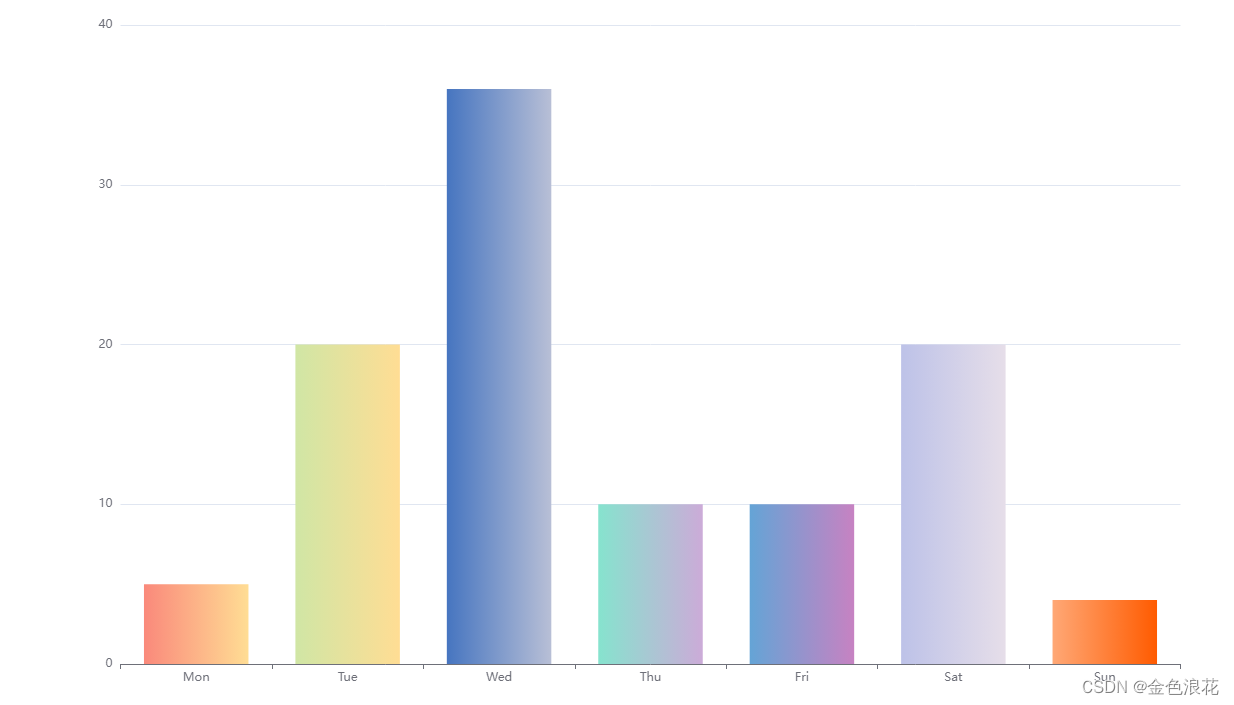
echarts图表渐变色 + 每个柱子不同颜色设置
echarts柱状图,默认所有柱子都是同一个颜色,显示效果差强人意,本文介绍如果修改成为每个柱子添加不同的颜色,以及如何添加渐变色,丰富图表的显示鲜果。先看效果:
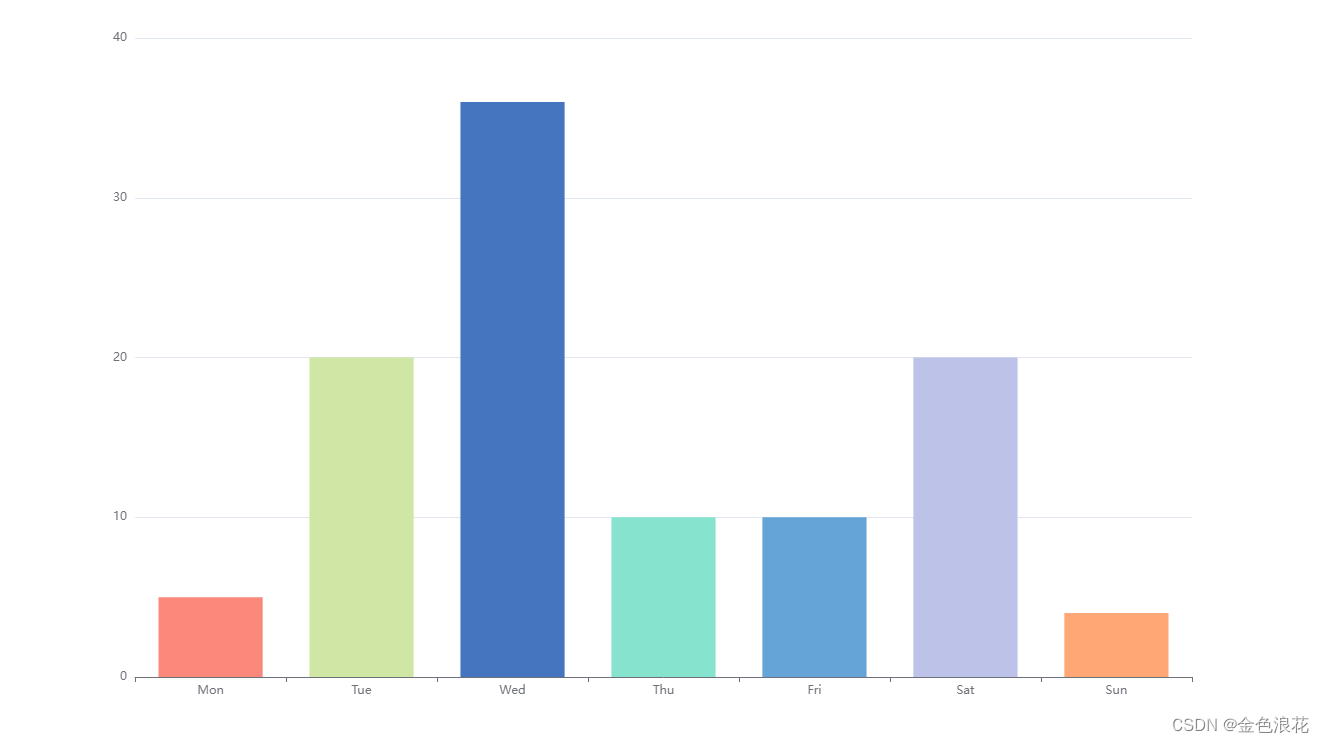 每个柱子颜色不同
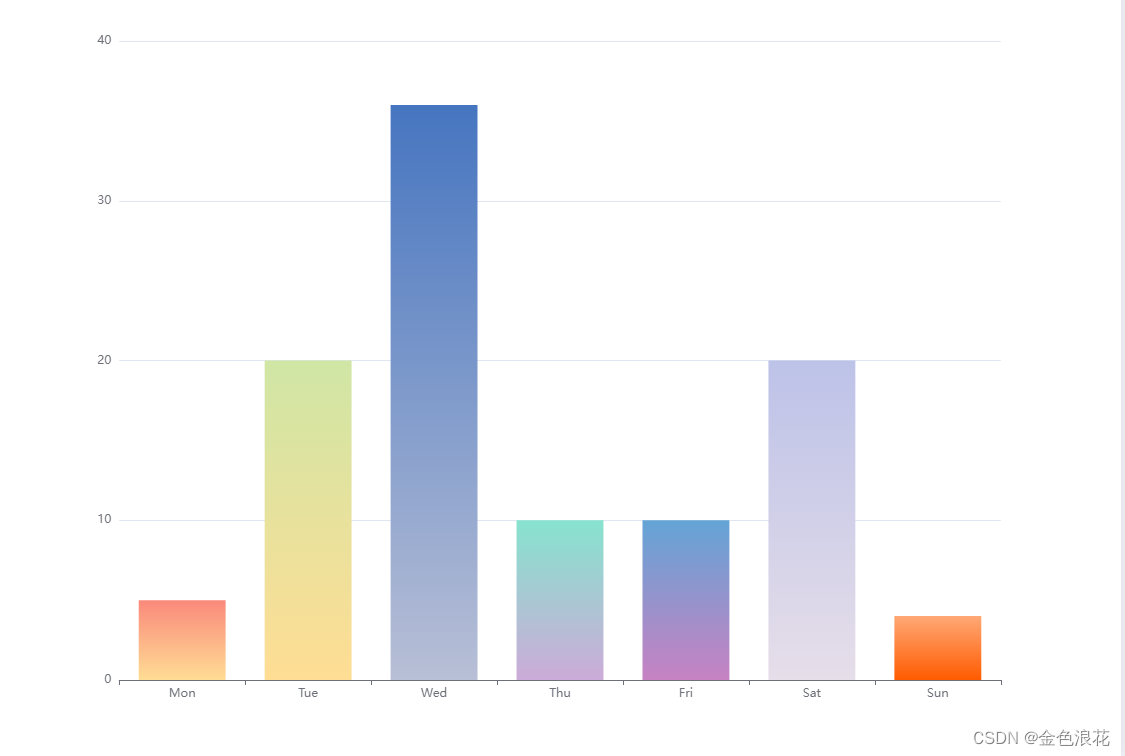
每个柱子都有自己的渐变色
1、为柱子设置不同颜色
方法一:series中的data属性设置为对象,value表示值,itemStyle.color可为每个子项设置不同样式,完整代码:
import * as echarts from 'echarts';

var chartDom = document.getElementById('main');
var myChart = echarts.init(chartDom);
var option;

option = {
  tooltip: {},
  legend: {},
  xAxis: {
    data: ['Mon', 'Tue', 'Wed', 'Thu', 'Fri', 'Sat', 'Sun']
  },
  yAxis: {},
  series: [
    {
      name: 'Sale',
      type: 'bar',
      data: [
        {
          value: 5,
          itemStyle: {
            color: '#FA897B'
          }
        },
        {
          value: 20,
          itemStyle: {
            color: '#D0E6A5'
          }
        },
        {
          value: 36,
          itemStyle: {
            color: '#4675C0'
          }
        },
        {
          value: 10,
          itemStyle: {
            color: '#86E3CE'
          }
        },
        {
          value: 10,
          itemStyle: {
            color: '#64A4D6'
          }
        },
        {
          value: 20,
          itemStyle: {
            color: '#bdc2e8'
          }
        },
        {
          value: 4,
          itemStyle: {
            color: '#FFA876'
          }
        }
      ]
    }
  ]
};

//5, 20, 36, 10, 10, 20, 4

option && myChart.setOption(option);
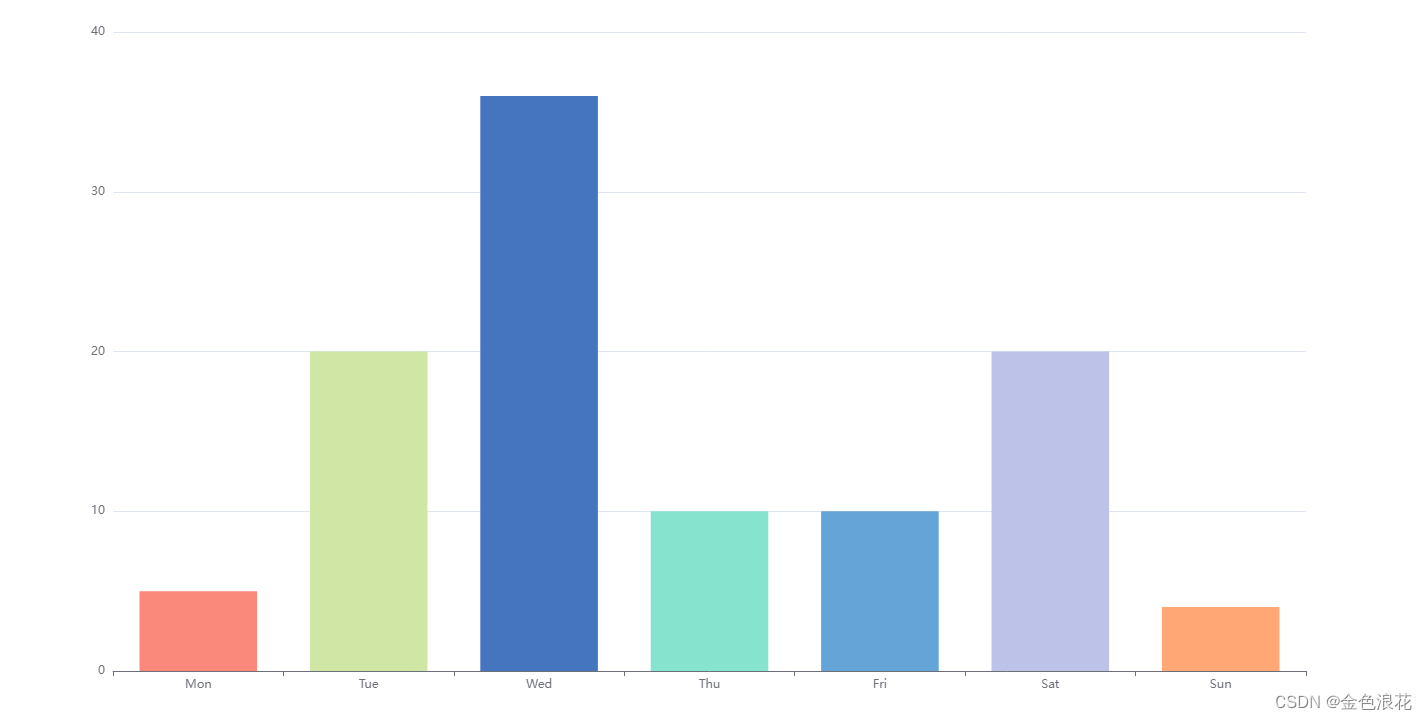
方法二:在series中有itemStyle属性,该属性支持使用回调函数,返回一个颜色字符串,完整代码:
import * as echarts from 'echarts';

var chartDom = document.getElementById('main');
var myChart = echarts.init(chartDom);
var option;

option = {
  tooltip: {},
  legend: {},
  xAxis: {
    data: ['Mon', 'Tue', 'Wed', 'Thu', 'Fri', 'Sat', 'Sun']
  },
  yAxis: {},
  series: [
    {
      name: 'Sale',
      type: 'bar',
      data: [5, 20, 36, 10, 10, 20, 4],
      itemStyle: {
        normal: {
          color: function (params) {
            let colorList = [
              '#FA897B',
              '#FFDD94',
              '#D0E6A5',
              '#FFDD94',
              '#4675C0',
              '#B8BFD6',
              '#FFA876'
            ];
            let colorItem = colorList[params.dataIndex];
            return colorItem;
          }
        }
      }
    }
  ]
};

option && myChart.setOption(option);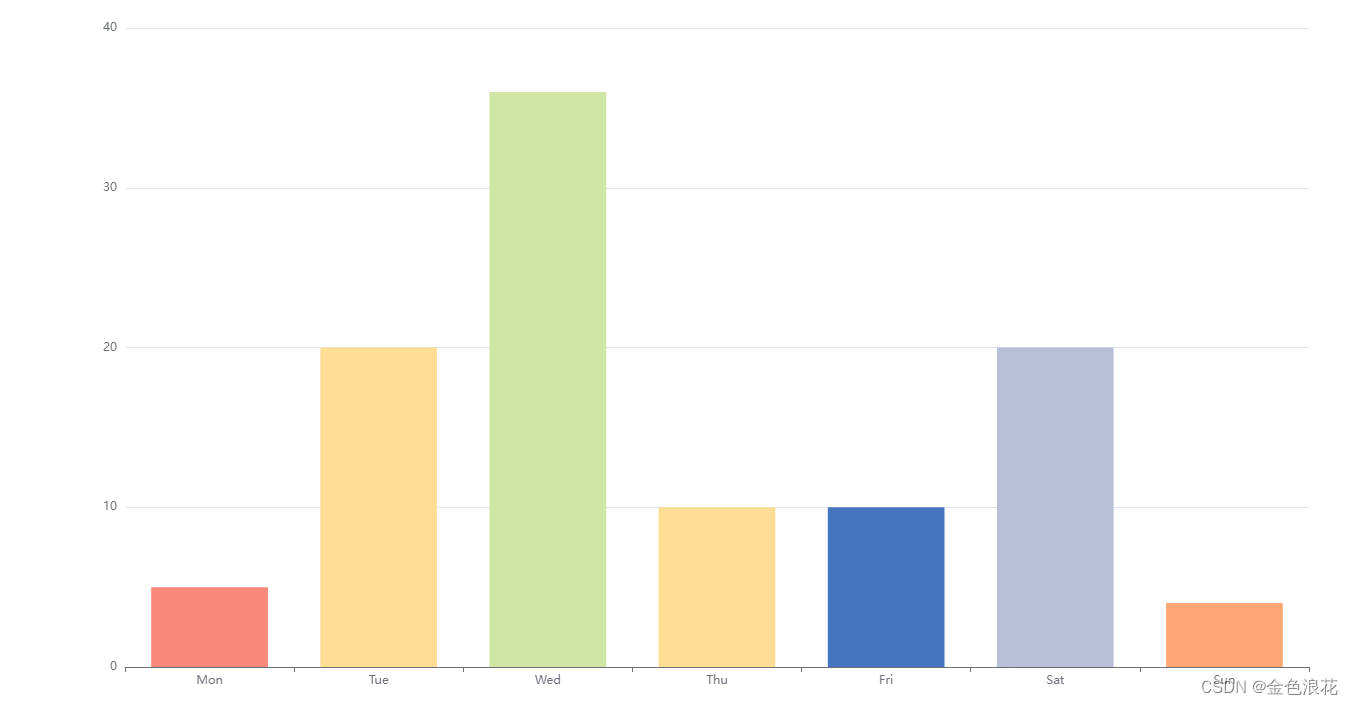
2、渐变色设置
还是在series中有itemStyle属性,该属性支持使用回调函数,使用echarts中自带的渐变色对象返回相关对象。完整代码:
import * as echarts from 'echarts';

var chartDom = document.getElementById('main');
var myChart = echarts.init(chartDom);
var option;

option = {
  tooltip: {},
  legend: {},
  xAxis: {
    data: ['Mon', 'Tue', 'Wed', 'Thu', 'Fri', 'Sat', 'Sun']
  },
  yAxis: {},
  series: [
    {
      name: 'Sale',
      type: 'bar',
      data: [5, 20, 36, 10, 10, 20, 4],
      itemStyle: {
        normal: {
          color: function (params) {
            let colorList = [
              ['#FA897B', '#FFDD94'],
              ['#D0E6A5', '#FFDD94'],
              ['#4675C0', '#B8BFD6'],
              ['#86E3CE', '#CCABD8'],
              ['#64A4D6', '#C782C2'],
              ['#bdc2e8', '#e6dee9'],
              ['#FFA876', '#FF5B00']
            ];
            let colorItem = colorList[params.dataIndex];
            return new echarts.graphic.LinearGradient(0,0,0,1, //y->y2
              [
                {
                  offset: 0,
                  color: colorItem[0]
                },
                {
                  offset: 1,
                  color: colorItem[1]
                }
              ],
              false
            );
          }
        }
      }
    }
  ]
};

option && myChart.setOption(option);
其中LinearGradient中的参数前四个参数分别代表:
- x : 从左向右 1 ——> 0
- y:从上向下 1 ——> 0
- x2:从右向左 1 ——> 0
- y2:从下向上 1 ——> 0
如果想要左右效果的渐变,那么只需修改x->x2即可
return new echarts.graphic.LinearGradient(0, 0, 1, 0, [{ // x->x2
                              offset: 0,
                              color: colorItem[0]
                          },
                          {
                              offset: 1,
                              color: colorItem[1]
                          }
                      ], false);