uniapp小程序使用地图 并且渲染坐标点 点击坐标点弹出对应的信息
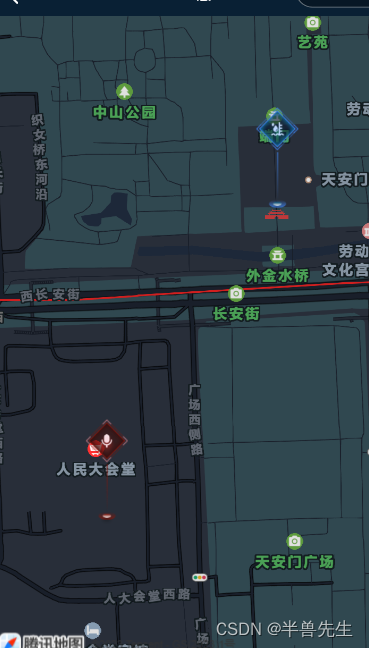
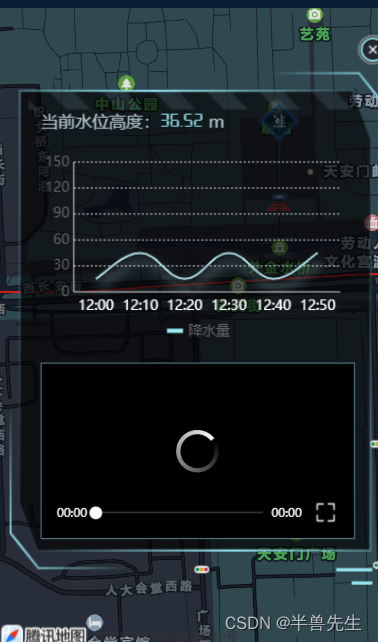
实现效果展示:


<template>
	<view class="map">
        <!-- subkey是在微信小程序官网申请的地图样式,比如申请黑暗系,会给一个key值,放在这里 -->
		<map subkey="Q6YBZ-XXXXX-C6UXD-XXXXX-SNFZ2-XXXXX" name="myMap" :longitude="mapCenter.longitude"
			:latitude="mapCenter.latitude" :markers="markers" @markertap="handleMarkerTap" enable-3D></map>
		<view class="bulletBox" v-if="closeShow">
			<view class="center">
				<view class="centers">
					<view style="color:#B2C7CE !important;font-size: 32rpx;display: flex;align-items: center;">
						<view>当前水位高度:</view>
						<view style="color: #9CEDF8;font-family: digifaw;font-size: 38rpx;">36.52</view>
						<view style="margin-left: 10rpx;">m</view>
					</view>
					<view class="echarts">
						<qiun-data-charts type="line" :opts="opts" :chartData="chartData" />
					</view>
					<view class="video">
						<video style="width: 100%;height:100%;border: 3rpx solid #7cbcc1;" controls autoplay
							src="https://haokan.baidu.com/5f6b3f0d-bcf3-44a9-800f-d0674189d876"></video>
					</view>
				</view>
				<img class="box" src="https://test.shipgroup.net/jd/img/box.png" alt="">
				<img @tap="close" class="clouse" src="https://test.shipgroup.net/jd/img/clouse.png" alt="">
			</view>
		</view>
	</view>
</template>

<script>
export default {
	data() {
		return {
			mapCenter: {
				longitude: "",
				latitude: "",
			},
			chartData: {},
			//您可以通过修改 config-ucharts.js 文件中下标为 ['line'] 的节点来配置全局默认参数,如都是默认参数,此处可以不传 opts 。实际应用过程中 opts 只需传入与全局默认参数中不一致的【某一个属性】即可实现同类型的图表显示不同的样式,达到页面简洁的需求。
			opts: {
				title: {
					color: '#fff'
				},
				color: ["#9CEDF8", "#9CEDF8", "#9CEDF8", "#9CEDF8", "#9CEDF8", "#9CEDF8", "#9CEDF8", "#9CEDF8", "#9CEDF8"],
				padding: [15, 15, 0, 0],
				dataLabel: false,
				dataPointShape: false,
				enableScroll: false,
				legend: {
					color: '#fff'
				},
				xAxis: {
					disableGrid: true,
					fontColor: '#ffffff'
				},
				yAxis: {
					name: '单位:毫米',
					nameTextStyle: {
						color: '#fff',
						fontSize: 14
					},
					labels: {
						fontColor: '#fff'
					},
					gridType: 'dash',
					dashLength: 2,
					data: [{
						min: 0,
						max: 150
					}]
				},
				extra: {
					line: {
						type: "curve",
						width: 2,
						activeType: "hollow",
						linearType: "custom",
						onShadow: true,
						animation: "horizontal"
					}
				}
			},
			closeShow: false,
			markers: []
		};
	},
	mounted() {
		this.getMarkers();
	},
	methods: {
		// 获取地图点位
		getMarkers() {
			let markesData = [
				{
					id: 1,
					longitude: 116.39748,
					latitude: 39.90882,
					iconPath: '/static/swjc.png',
					width: 40,
					height: 100,
					callout: {
						content: '首都机场',
						fontSize: 14,
						borderRadius: 5,
						bgColor: '#ffffff',
						padding: 6,
						textAlign: 'center'
					}
				},
				{
					id: 2,
					longitude: 116.39404,
					latitude: 39.90399,
					iconPath: '/static/dbsb.png',
					width: 40,
					height: 100,
					callout: {
						content: '人民广场',
						fontSize: 14,
						borderRadius: 5,
						bgColor: '#ffffff',
						padding: 6,
						textAlign: 'center'
					}
				}
			]
			this.markers = markesData
			this.mapCenter = {
				longitude: this.calculateCenter(markesData).longitude,
				latitude: this.calculateCenter(markesData).latitude,
			}
			console.log(666666, this.mapCenter);
		},
		// 计算地图的中心点
		calculateCenter(markesData) {
			var sumLongitude = 0;
			var sumLatitude = 0;
			for (var i = 0; i < markesData.length; i++) {
				sumLongitude += markesData[i].longitude;
				sumLatitude += markesData[i].latitude;
			}
			var averageLongitude = sumLongitude / markesData.length;
			var averageLatitude = sumLatitude / markesData.length;
			return {
				longitude: averageLongitude,
				latitude: averageLatitude
			};
		},
		close() {
			this.closeShow = false
		},
		handleMarkerTap(event) {
			console.log('经度:', event)
			console.log('纬度:', event)
			this.closeShow = true
			this.echartsShow()
		},
		echartsShow() {
			this.getServerData();
		},
		getServerData() {
			//模拟从服务器获取数据时的延时
			setTimeout(() => {
				//模拟服务器返回数据,如果数据格式和标准格式不同,需自行按下面的格式拼接
				let res = {
					categories: ["12:00", "12:10", "12:20", "12:30", "12:40", "12:50"],
					series: [
						{
							name: "降水量",
							linearColor: [
								[
									0,
									"#a8d4de"
								],
								[
									0.25,
									"#a8d4de"
								],
								[
									0.5,
									"#a8d4de"
								],
								[
									0.75,
									"#a8d4de"
								],
								[
									1,
									"#a8d4de"
								]
							],
							setShadow: [
								3,
								8,
								10,
								"#a8d4de"
							],
							data: [15, 45, 15, 45, 15, 45]
						}
					]
				};
				this.chartData = JSON.parse(JSON.stringify(res));
			}, 500);
		},

	}
};
</script>

<style>
@font-face {
	font-family: 'digifaw';
	src: url('../../static/font/digifaw.ttf') format('woff2'),
		url('../../static/font/digifaw.ttf') format('woff');
	font-weight: normal;
	font-style: normal;
}

.map,
map {
	width: 100%;
	height: 100vh;
}

.bulletBox {
	position: fixed;
	z-index: 999;
	top: 50%;
	left: 50%;
	transform: translate(-50%, -50%);
	width: 95%;
	height: 80%;
}

.center {
	position: relative;
	width: 100%;
	height: 100%;
}

.centers {
	position: absolute;
	display: flex;
	flex-flow: column;
	justify-content: space-between;
	top: 70rpx;
	bottom: 90rpx;
	left: 60rpx;
	right: 60rpx;
	z-index: 9999999;
}

.box {
	position: absolute;
	bottom: 0;
	width: 100%;
	height: 100%;
}

.clouse {
	position: absolute;
	width: 56rpx;
	height: 56rpx;
	right: 0;
	top: -70rpx;
}

.echarts {
	width: 100%;
	height: 380rpx;
}

.video {
	width: 99%;
	height: 328rpx;
	box-sizing: border-box;
}
</style>

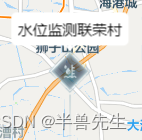
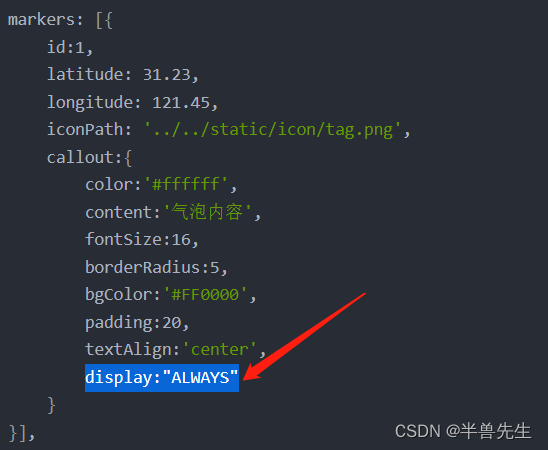
点位顶部如果想要显示名字,可以在这里加入这段代码,官网可以查看详情map | 微信开放文档
